
Update on Wairarapa housing data
Once again Planalytics is pleased to present housing data for our communities in Wairarapa as at 30 June 2023. It is interesting to review trends since our last data snapshot provided as at 30 June 2022. Want to know what has shifted over the past 12 months? Check out our housing dashboard below. We hope this information is useful to people and organisations currently in, about to enter, or otherwise working alongside the local housing market.

SO WHAT is the data telling us?
191 new dwellings were consented in Wairarapa in the first six-months of the 2023 calendar year. This included 79 in the June quarter (Q2), down from 112 new dwellings consented in the March quarter (Q1).
The latest quarterly Tenancy Services rental bond data indicates that Carterton district had the highest median residential rent across Wairarapa in Q1, surpassed by South Wairarapa district in Q2. Both districts showed distinct variation across the six-month period, whereas the median residential rent in Masterton district remained relatively stable with a slight increase (9%).
There were 385 house sales in Wairarapa over the six-months to June 2023; with sales volumes in Q2 being 19% higher than Q1. This growth may indicate a slight upturn in the market, however, with only 678 houses sold in the year to June 2023 (13% down on the previous year) it may still be some time before we come close to the 10 year average of 912 houses sold.
The average house value in Wairarapa in June 2023 was $626,277, being 17% down on June 2022 (Infometrics, 2023). Across the three districts, the highest average property values for the first half of the calendar year were seen in January (Masterton) and February (Carterton and South Wairarapa). From that point, all districts experienced a drop with Masterton prices dropping by 8% from almost $600,000 in January to just over $550,000 in June.
IS HOUSING becoming MORE OR LESS AFFORDABLE?
Average household income has increased since Q2 2022 but still sits below the national average of $126,805 in all Wairarapa districts according to a recent housing affordability report by Corelogic. Accompany that rise with average dwelling prices dropping over the previous 12 months and it is not surprising to find that the value to income ratio, which measures how many times higher average house prices are than household income, has also dropped across the region.
How long it takes to save a deposit has also generally been helped over the past year or two by rising household incomes and falling house prices. In the June 2023 quarter, it would take 9.5 years to save a 20% deposit for a house in South Wairarapa (similar to the national figure of 9.6 years). This is an improvement on the same period in 2022, when it would take over 11 years for people to save a 20% deposit for a house in South Wairarapa district. The number of years to save a deposit has dropped for both Carterton and Masterton districts also.
Rent absorbs around a quarter of gross household income across Wairarapa, which is above the national long-term average of 21%. Carterton and South Wairarapa districts have had no change in this measure since Q2 2022. However, Masterton has increased from 23% to 25%, now the highest of the three districts.
Across the country, as in our region, data indicates that housing affordability has generally started to improve as property values have fallen and incomes have risen. However, increases in mortgage rates mean that the share of gross household income needed to service an 80% mortgage loan remained high. Indeed, in 2022 mortgage payments as a share of income in South Wairarapa district were 52%, and as at Q2 2023, were 49% (same as the national figure).

A WEE POINT AROUND RENT AFFORDABILITY
It is important to note that some households will be finding it much harder than these figures suggest, given that many renting households may actually have incomes below the average.
Housing affordability is also gauged by statistics regarding demand for public housing.

THE HOUSING REGISTER
The Housing Register captures the housing requirements of people who have applied for public housing through the Ministry of Social Development (MSD).
Carterton and South Wairarapa housing register numbers have remained steady with less than 30 applicants in each district since Q1 2021. Masterton peaked in the first half of 2022 reaching 160 applicants and at June 2023 was sitting at 140.
On a positive note, the number of public housing tenancies (available housing units) has steadily increased in Masterton over the last couple of years from 209 in Q2 2021 to 259 in Q2 2023 (a 24% increase) according to the Ministry for Housing and Urban Development’s Public Housing Regional Factsheets. In the South Wairarapa and Carterton districts, numbers have remained static with under 20 tenancies in both districts over the past few years.

WHAT ARE SPECIAL NEEDS GRANTS?
The purpose of the Emergency Housing Special Needs Grant (EH SNG) is to help individuals and families with the cost of staying in short-term accommodation for up to seven days at a time, if they have nowhere else to stay.
EMERGENCY HOUSING GRANTS DECREASING IN OUR REGION
In the quarter ending 30 June 2023, there were 110 emergency housing grants approved in Wairarapa (compared with 251 grants made in the same quarter 2022). All grants approved in 2023 were to Masterton-based applicants.
The amount awarded in the June 2023 quarter in Wairarapa was $273,103, a 51% decrease on the same period in 2022. However, this is an 8% increase on the previous quarter’s amount, despite the fact that the number of grants awarded fell by 16%. This may suggest an increase in the cost of emergency housing in Masterton.
The number of First Home Grant applications approved increased in Masterton from the first quarter to the second quarter 2023 but decreased in Carterton and South Wairarapa districts. All of the 39 first home grant applications approved across the three districts were for existing homes, not new builds.

FIRST HOME GRANTS
The First Home Grant, administered by Kāinga Ora, provides each eligible first-home buyer with a grant of up to $5,000 to put towards the purchase of an existing/older home or up to $10,000 to help with purchasing a brand-new property.
data is only one piece of the puzzle
Analysis of local housing data provides useful insight into market conditions. However, data is only one piece of the puzzle.
As noted above, the data is telling us that housing affordability is improving in Wairarapa. Anecdotally, however, we are hearing a different story. It is incumbent on decision-makers to understand lived experiences of our local housing market and we welcome more qualitative research on this topic in our region.
As a starting point, we hope the Planalytics housing dashboard provides a useful tool for understanding what’s happening here in Wairarapa. Please do not hesitate to contact us at office@planalytics.co.nz if you have any additional observations or need for data visualisation. We are your local data geeks!
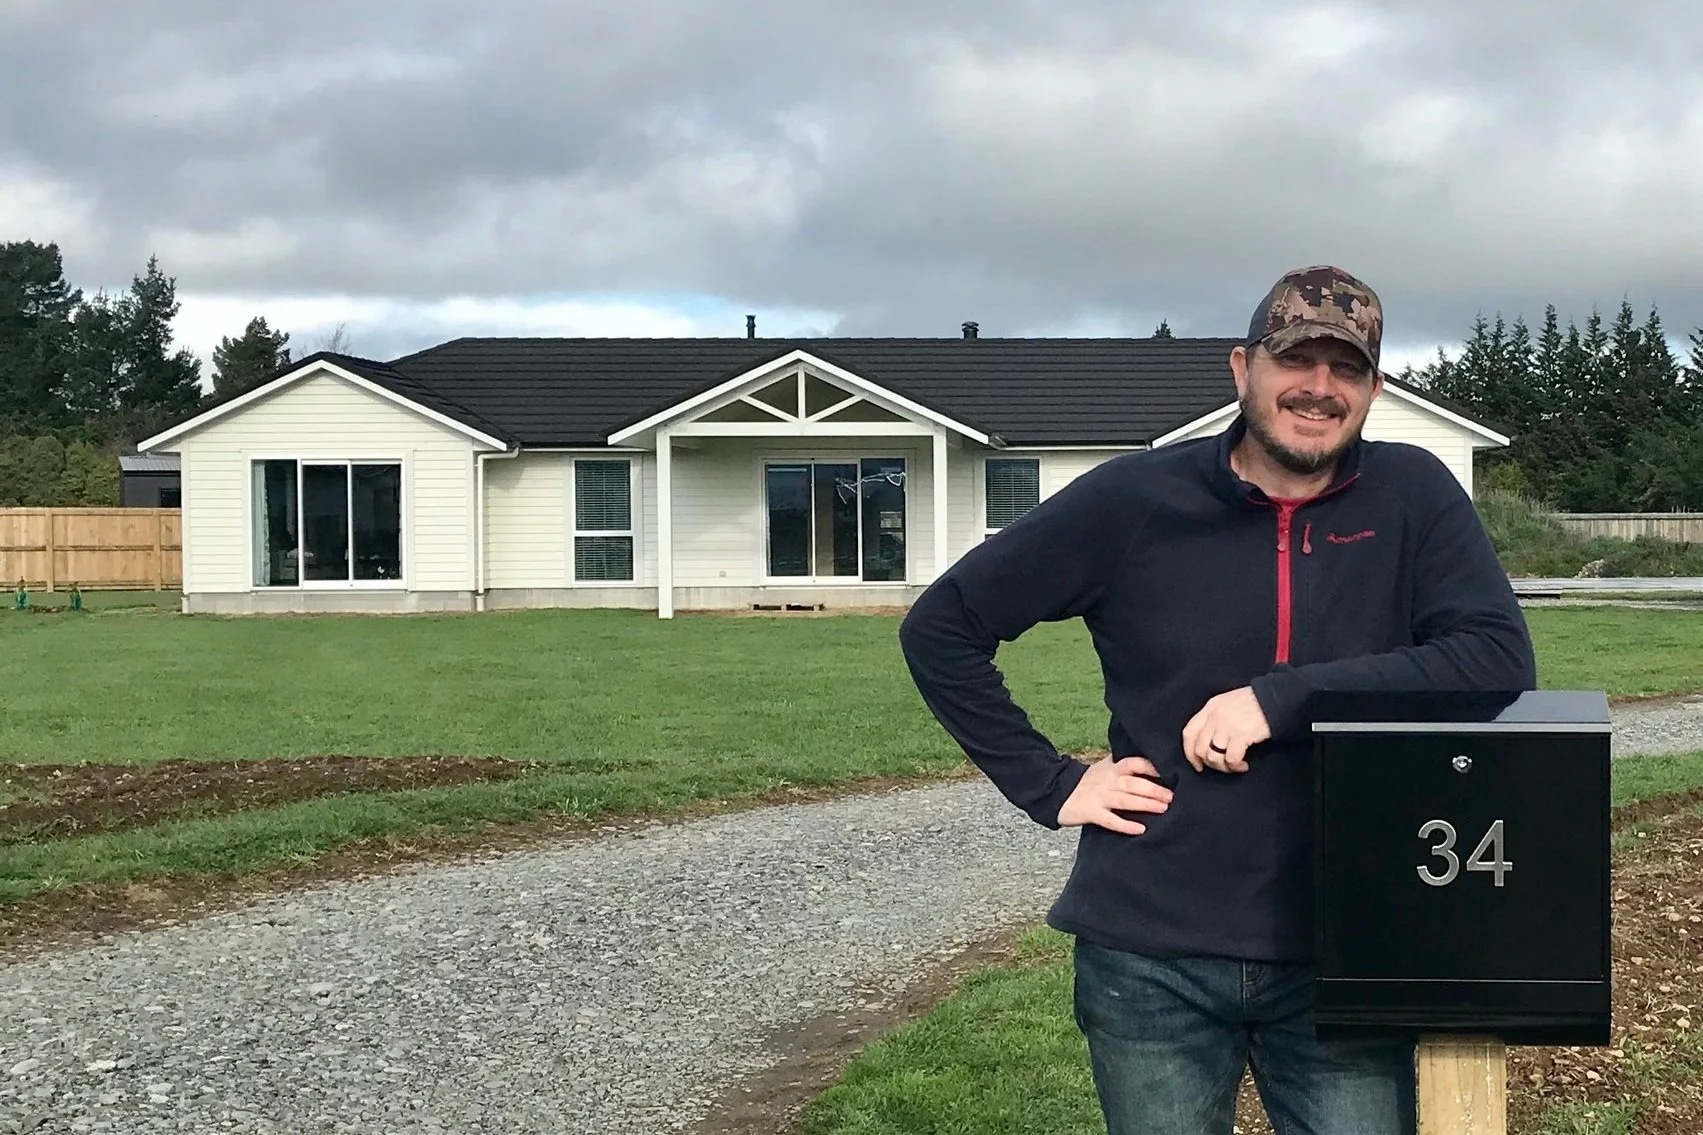
A new home owner in Carterton.